
Measures of Relationship
Topics Covered in this Session
- Correlational Coefficient
- Linear Regression
- Multiple Regression
- Discriminant Analysis
- Factor Analysis
Measures of Relationship
Definition – are statistical measures which show a relationship between two or more variables or two or more sets of data. For example, generally there is a high relationship or correlation between parent’s education and academic achievement. On the other hand, there is generally no relationship or correlation between a person’s height and academic achievement. The major statistical measure of relationship is the correlation coefficient.
Correlational Coefficient
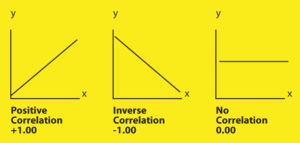
- Correlation is the relationship between two or more variables or sets of data. It is expressed in the form of a coefficient with +1.00 indicating a perfect positive correlation; -1.00 indicating a perfect inverse correlation; 0.00 indicating a complete lack of a relationship. Note: A simplified method of determining the magnitude of a correlation is as follows: .00 – .20 Negligible .20 – .40 Low .40 – .60 Moderate .60 – .80 Substantial .80 – 1.0 High
- Pearson’s Product Moment Coefficient (r) is the most often used and most precise coefficient; and generally used with continuous variables.
- Spearman Rank Order Coefficient (p) is a form of the Pearson’s Product Moment Coefficient which can be used with ordinal or ranked data.
- Phi Correlation Coefficient is a form of the Pearson’s Product Moment Coefficient which can be used with dichotomous variables (i.e. pass/fail, male/female).
In published studies or reports, correlational coefficients are usually displayed as a r values.
For example, r = .66, p < .01 where r is the correlational coefficient and p is the level (.01) of statistical significance.
Linear (Line) Representations of Correlation Coefficients
Linear Regression and Multiple Regression
-
- Linear regression is the use of correlation coefficients to plot a line illustrating the linear relationship of two variables X and Y. It is based on the slope of the line which is represented by the formula : Y = a + bX where
- Y = dependent variable
- X = independent variable
- b = slope of the line
- a = constant or Y intercept Regression is used extensively in making predictions based on finding unknown Y values from known X values. For example, the linear regression formula for predicting college GPA from known high school grade point averages would be displayed as follows: College GPA = a + b(High School GPA
- Multiple Regression is the same as regression except that it attempts to predict Y from two or more independent X variables. The formula for multiple regression is an extension of the linear regression formula: Y = a + b1 X1 + b2 X2 + …. Multiple regression is used extensively in making predictions based on finding unknown Y values from known X values. For example, the multiple regression formula for predicting college GPA from known high school grade point averages and SAT scores would be displayed as follows: College GPA = a + b1(High School GPA) + b2(SAT Score)
- Linear regression is the use of correlation coefficients to plot a line illustrating the linear relationship of two variables X and Y. It is based on the slope of the line which is represented by the formula : Y = a + bX where
Discriminant Analysis
Discriminant analysis is analogous to multiple regression, except that the criterion variable consists of two categories rather than a continuous range of values.
Factor Analysis
Factor analysis is often used when a large number of correlations have been explored in a given study; it is a means of grouping into clusters or factors, certain variables that are moderately to highly correlated with each other.