Topics Covered in this Session
- Range, Deviation, Variance, Standard Deviation
- Normal Distribution
- t-test
- Analysis of Variance, Scheffe Test, Chi-Square

Measures of Dispersion or Spread
Definition - are statistical measures which show contrasts or differences in a group of values. The major measures of spread are the range, deviation, variance, and standard deviation.
- Range - is the difference between the highest and lowest values in a group of values. For example, the range of the following group of values 60,70,80,90,100 is 40 and is calculated by subtracting the lowest value (60) from the highest value (100) = 400.
- The range is the simplest measure of dispersion and is useful in making an initial determination of the spread in a group of values.
- Deviation - is the difference (distance + or -) between a value and the mean of a group of values. For example: if we look again at the group of values used above (60,70,80,90,100), the deviation of the value 90 in the above group of values is 10, and is calculated by subtracting the mean (80) from the value (90). Try doing the calculation for the other values in the group. What is the deviation for the value 60. If your answer is -20, you are correct.
- The deviation is used to determine the distance of one score from the mean. It is also used extensively in other formulae.
- Variance - is the sum of all the squared deviations from the mean divided by the number (N) of values in the group; in groups of values with an N less than 15, it is the sum of all the squared deviations from the mean divided by N-1. For example, the variance of the group of values 60,70,80,90,100 is 250 and is calculated as follows:
deviation of 60 from the mean (80) = -20 x -20 = 400
deviation of 70 from the mean (80) = -10 x -10 = 100
deviation of 80 from the mean (80) = 0 x 0 = 0
deviation of 90 from the mean (80) = +10 x +10 = 100
deviation of 100 from the mean (80) = +20 x +20 = 400
Sum of the squared deviations (400+100+0+100+400 = 1000) and dividing by 4 (N-1) = 1000 / 4 = 250.
The variance is used frequently in a variety of statistical formulae. However, because the deviations are squared, it becomes too large a value in relation to the values in the group (i.e. variance of 250 for values of 60,70,80,90,100) to be used as a descriptive measure.
- Standard Deviation - is the square root of the variance, and the most frequently used measure of dispersion. The standard deviation or S.D. for the above is 15.811 and is calculated by getting the square root of the variance (250) which = 15.811.
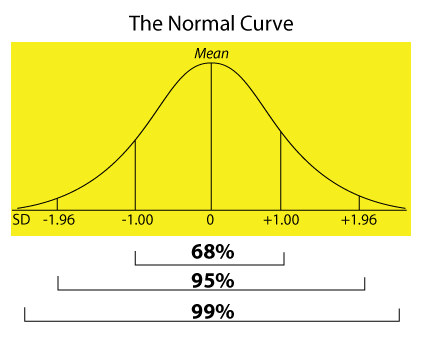
Normal Distribution (Curve)
The normal distribution or curve is based on the standard deviation of the sample. In a normal distribution, the distance from one S.D. above the mean to one S.D. below the mean includes approximately 68 percent of all the scores. Plus two to minus two S.D. includes approximately 95 percent of all scores and plus three to minus three S.D. includes over 99 percent of all scores.
| |
|
 |
|
|
The t-test and analysis of variance (ANOVA) statistical procedures assume normal distributions and make extensive use of the mean and variance to determine the significance of the differences of the means of two or more groups of values.
The t-test is a parametric (assumes normal distribution) test to determine the significance of the difference between the means of the two groups. The t-test uses the mean, the variance and a Table of Critical Values for the "t" Distribution. The rejection or acceptance of the significance of the differences in two means is based on a standard that no more than 5% of the difference is due to chance or sampling error, and that the same difference would occur 95% of the time should the test be repeated. Some researchers use a more rigorous standard of 1% (.01 Level), and that the same difference would occur 99% of the time should the test be repeated.
The t-test usually is displayed in a study or report as follows: The experiment or treatment group (M=86.50, SD=4.31) scored significantly higher than the control group (M=79.10, SD=5.22), t(80) = 4.90, p<.05 where
- M = Mean
- SD = Standard Deviation
- t = t value
- Number in parenthesis (80) after the t value = N (number of cases adjusted for degrees of freedom)
- p = indicates the level of statistically significant difference (i.e .05 level) between the two means.
In the above example, p is the bottom line value and indicates at what level a statistically significant difference exists.
Analysis of Variance (ANOVA)
Analysis of variance is a statistical measure used for determining whether differences exist among two or more groups. It does this by comparing the means of the groups to see if they are statistically different. Analysis of variance uses the mean, the variance and a Table of Critical Values for "F" Distribution to calculate an F statistic. Analysis of variance is a parametric (assumes normal distribution) test. Statistical significance of the differences in two or more means is based on a standard that no more than 5% (.05 Level) of the difference is due to chance or sampling error, and that the same difference would occur 95% of the time should the test be repeated. Some researchers use a more rigorous standard of 1% (.01 Level), and that the same difference would occur 99% of the time should the test be repeated.
Analysis of variance can be used for several different types of analyses.
- Oneway Analysis of Variance - assumes there are two variables with one variable a dependent, interval or ratio variable (numerical data that show quantity and direction), and one variable, an independent, nominal variable or factor such as an ethnicity code or sex code.
- N-way Analysis of Variance - assumes there are more than two variables with one variable a dependent, interval or ratio variable and two or more, independent, nominal variables or factors such as ethnicity code or sex code.
- Multiple Regression - assumes there are more than two variables with one variable a dependent, interval or ratio variable and two or more, independent, interval or ratio variables such as test scores, income, grade point average, etc.
- Analysis of Covariance - assumes there are more than two variables with one variable a dependent, interval or variable and two or more variables are a combination of independent, nominal, interval or ratio variables
Depending on the options used, ANOVA can be displayed in different ways in a study or a report. For an N-way ANOVA, the following is typical. The analysis of variance indicated that there were significant differences among the four groups F(3, 96)=7.50, p<.01 where
- F = the F statistic
- The two numbers in parentheses (3,96) = the number of groups and N (number of cases adjusted for degrees of freedom)
- p = indicates the level of statistically significant difference (i.e .01 level) among the means
In the above example, p is the bottom line value and indicates at what level a statistically significant difference exists.
Scheffe Test
The Scheffe test is used with ANOVA (Analysis of Variance) to determine which variable(s) among several independent variables is statistically the most different.
Chi-Square
t-test and analysis of variance are parametric statistical procedures that assume that the distributions are normal or nearly normal and is used when variables are continuous such as test scores and grade point averages. Chi-square is a nonparametric statistical procedure used to determine the significance of the difference between groups when data are nominal and placed in categories such as gender or ethnicity. This procedure compares what is observed against what was expected.
FOR MORE INFORMATION ON THE TOPICS COVERED IN THIS SESSION, PLEASE REFER TO THE APPENDIX IN A.G. PICCIANO "EDUCATIONAL RESEARCH PRIMER" AS WELL AS THE MANUALS AND DOCUMENTATION PROVIDED BY SPSS, INC. |