Topics Covered in this Session
- Correlational Coefficient
- Linear Regression
- Multiple Regression
- Discriminant Analysis
- Factor Analysis

Measures of Relationship
Definition - are statistical measures which show a relationship between two or more variables or two or more sets of data. For example, generally there is a high relationship or correlation between parent's education and academic achievement. On the other hand, there is generally no relationship or correlation between a person's height and academic achievement. The major statistical measure of relationship is the correlation coefficient.
Correlational Coefficient
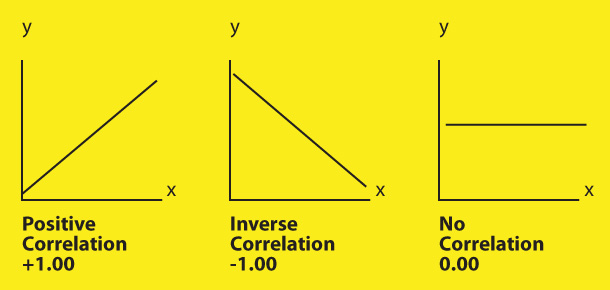
- Correlation is the relationship between two or more variables or sets of data. It is expressed in the form of a coefficient with +1.00 indicating a perfect positive correlation; -1.00 indicating a perfect inverse correlation; 0.00 indicating a complete lack of a relationship.
Note: A simplified method of determining the magnitude of a correlation is as follows:
•.00 - .20 Negligible
• .20 - .40 Low
* .40 - .60 Moderate
* .60 - .80 Substantial
* .80 - 1.0 High
- Pearson's Product Moment Coefficient (r) is the most often used and most precise coefficient; and generally used with continuous variables.
- Spearman Rank Order Coefficient (p) is a form of the Pearson's Product Moment Coefficient which can be used with ordinal or ranked data.
- Phi Correlation Coefficient is a form of the Pearson's Product Moment Coefficient which can be used with dichotomous variables (i.e. pass/fail, male/female).
In published studies or reports, correlational coefficients are usually displayed as a r values.
For example, r = .66, p < .01 where r is the correlational coefficient and p is the level (.01) of statistical significance.
| |
|
Linear (Line) Representations of Correlation Coefficients
|
|
|
Linear Regression and Multiple Regression
- Linear regression is the use of correlation coefficients to plot a line illustrating the linear relationship of two variables X and Y. It is based on the slope of the line which is represented by the formula : Y = a + bX where
* Y = dependent variable
* X = independent variable
* b = slope of the line
* a = constant or Y intercept
Regression is used extensively in making predictions based on finding unknown Y values from known X values. For example, the linear regression formula for predicting college GPA from known high school grade point averages would be displayed as follows:
College GPA = a + b(High School GPA
- Multiple Regression is the same as regression except that it attempts to predict Y from two or more independent X variables. The formula for multiple regression is an extension of the linear regression formula: Y = a + b1 X1 + b2 X2 + ....
Multiple regression is used extensively in making predictions based on finding unknown Y values from known X values. For example, the multiple regression formula for predicting college GPA from known high school grade point averages and SAT scores would be displayed as follows:
College GPA = a + b1(High School GPA) + b2(SAT Score)
Discriminant Analysis
Discriminant analysis is analogous to multiple regression, except that the criterion variable consists of two categories rather than a continuous range of values.
Factor Analysis
Factor analysis is often used when a large number of correlations have been explored in a given study; it is a means of grouping into clusters or factors, certain variables that are moderately to highly correlated with each other.
FOR MORE INFORMATION ON THE TOPICS COVERED IN THIS SESSION, PLEASE REFER TO THE APPENDIX IN A.G. PICCIANO "EDUCATIONAL RESEARCH PRIMER" AS WELL AS THE MANUALS AND DOCUMENTATION PROVIDED BY SPSS, INC. |