Topics Covered in this Session
- Normal Distribution
- Standard Deviation, Sigma (z) Score, T Score, College Board Score
- Percentiles and Stanines

Measures of Relative Position
Definition - are conversions of values, usually standardized test scores, to show where a given value stands in relation to other values of the same grouping. The most common example in education is the conversion of scores on standardized tests to show where a given student stands in relation to other students of the same age, grade level, etc. Converted scores are based on the standard deviation or distance of a raw score from the mean for a normal curve or distribution.
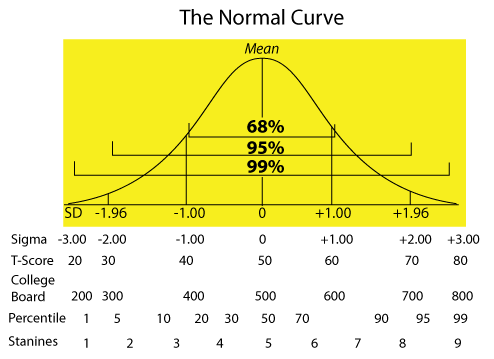
In a normal distribution, the distance from one S.D. above the mean to one S.D. below the mean includes approximately 68 percent of all the scores. Plus two to minus two S.D. includes approximately 95 percent of all scores and plus three to minus three S.D. includes over 99 percent of all scores.
| |
|
 |
Standard Deviation, Sigma (z) Score, T Score, College Board Score
Converted scores, also referred to as standard scores are based on the standard deviation or distance of a raw score from the mean for a normal curve or distribution. Examples of standard scores used in educational research are: Sigma (z) scores, T scores, College Board scores, percentiles, and stanines.
- Sigma (z) Score - the deviation from the mean divided by the standard deviation. It is used to describe a score's deviation from the mean. The range of z scores is usually -3.00 to +3.00 with a value at the mean of 0.00. For example: a standardized test with a mean of 70 and a standard deviation of 10, a score of 60 would be -10 points from the mean (deviation), divided by the standard deviation (10) equals a z score of -1.00. Try calculating the z scores for scores of 85, 90, 50.
Remember z scores can have negative as well as positive values. If your answers are +1.50, +2.00 and -2.00, they are correct.
- T Score - a variation of the z score which produces a standard score with a range of 20 to 80 and a mean of 50. It eliminates the decimal and negative z score numbers which are sometimes awkward to work with. The T score is calculated as follows:
T score = 50 + 10 x Sigma (z) score
For example, a z score of -2.00 would have a T score = 50 + 10 x -2.00 or 50 + (-20) or 30.
- College Board Score - a variation of the z score which produces a standard score with a range of 200 to 800 and a mean of 500. It is used to spread out the scale. The College Board score is calculated as follows:
College Board score = 500 + 100 x Sigma (z) score
For example, a z score of -2.00 would have a College Board score = 500 + 100 x -2.00 or 500 + (-200) or 300
Percentile and Stanines
Percentiles and stanines help give comparative meanings to raw scores.
- Percentile - the point in the distribution below which a given percentage of scores fall. For example, if a score of 65 is at the seventieth percentile then 70 percent of the scores fall below 65.
- Stanine - a conversion of raw scores into nine bands or stanines, with the 5th stanine being at the mean, 1st stanine the lowest, and 9th stanine the highest.
FOR MORE INFORMATION ON THE TOPICS COVERED IN THIS SESSION, PLEASE REFER TO THE APPENDIX IN A.G. PICCIANO "EDUCATIONAL RESEARCH PRIMER" AS WELL AS THE MANUALS AND DOCUMENTATION PROVIDED BY SPSS, INC. |